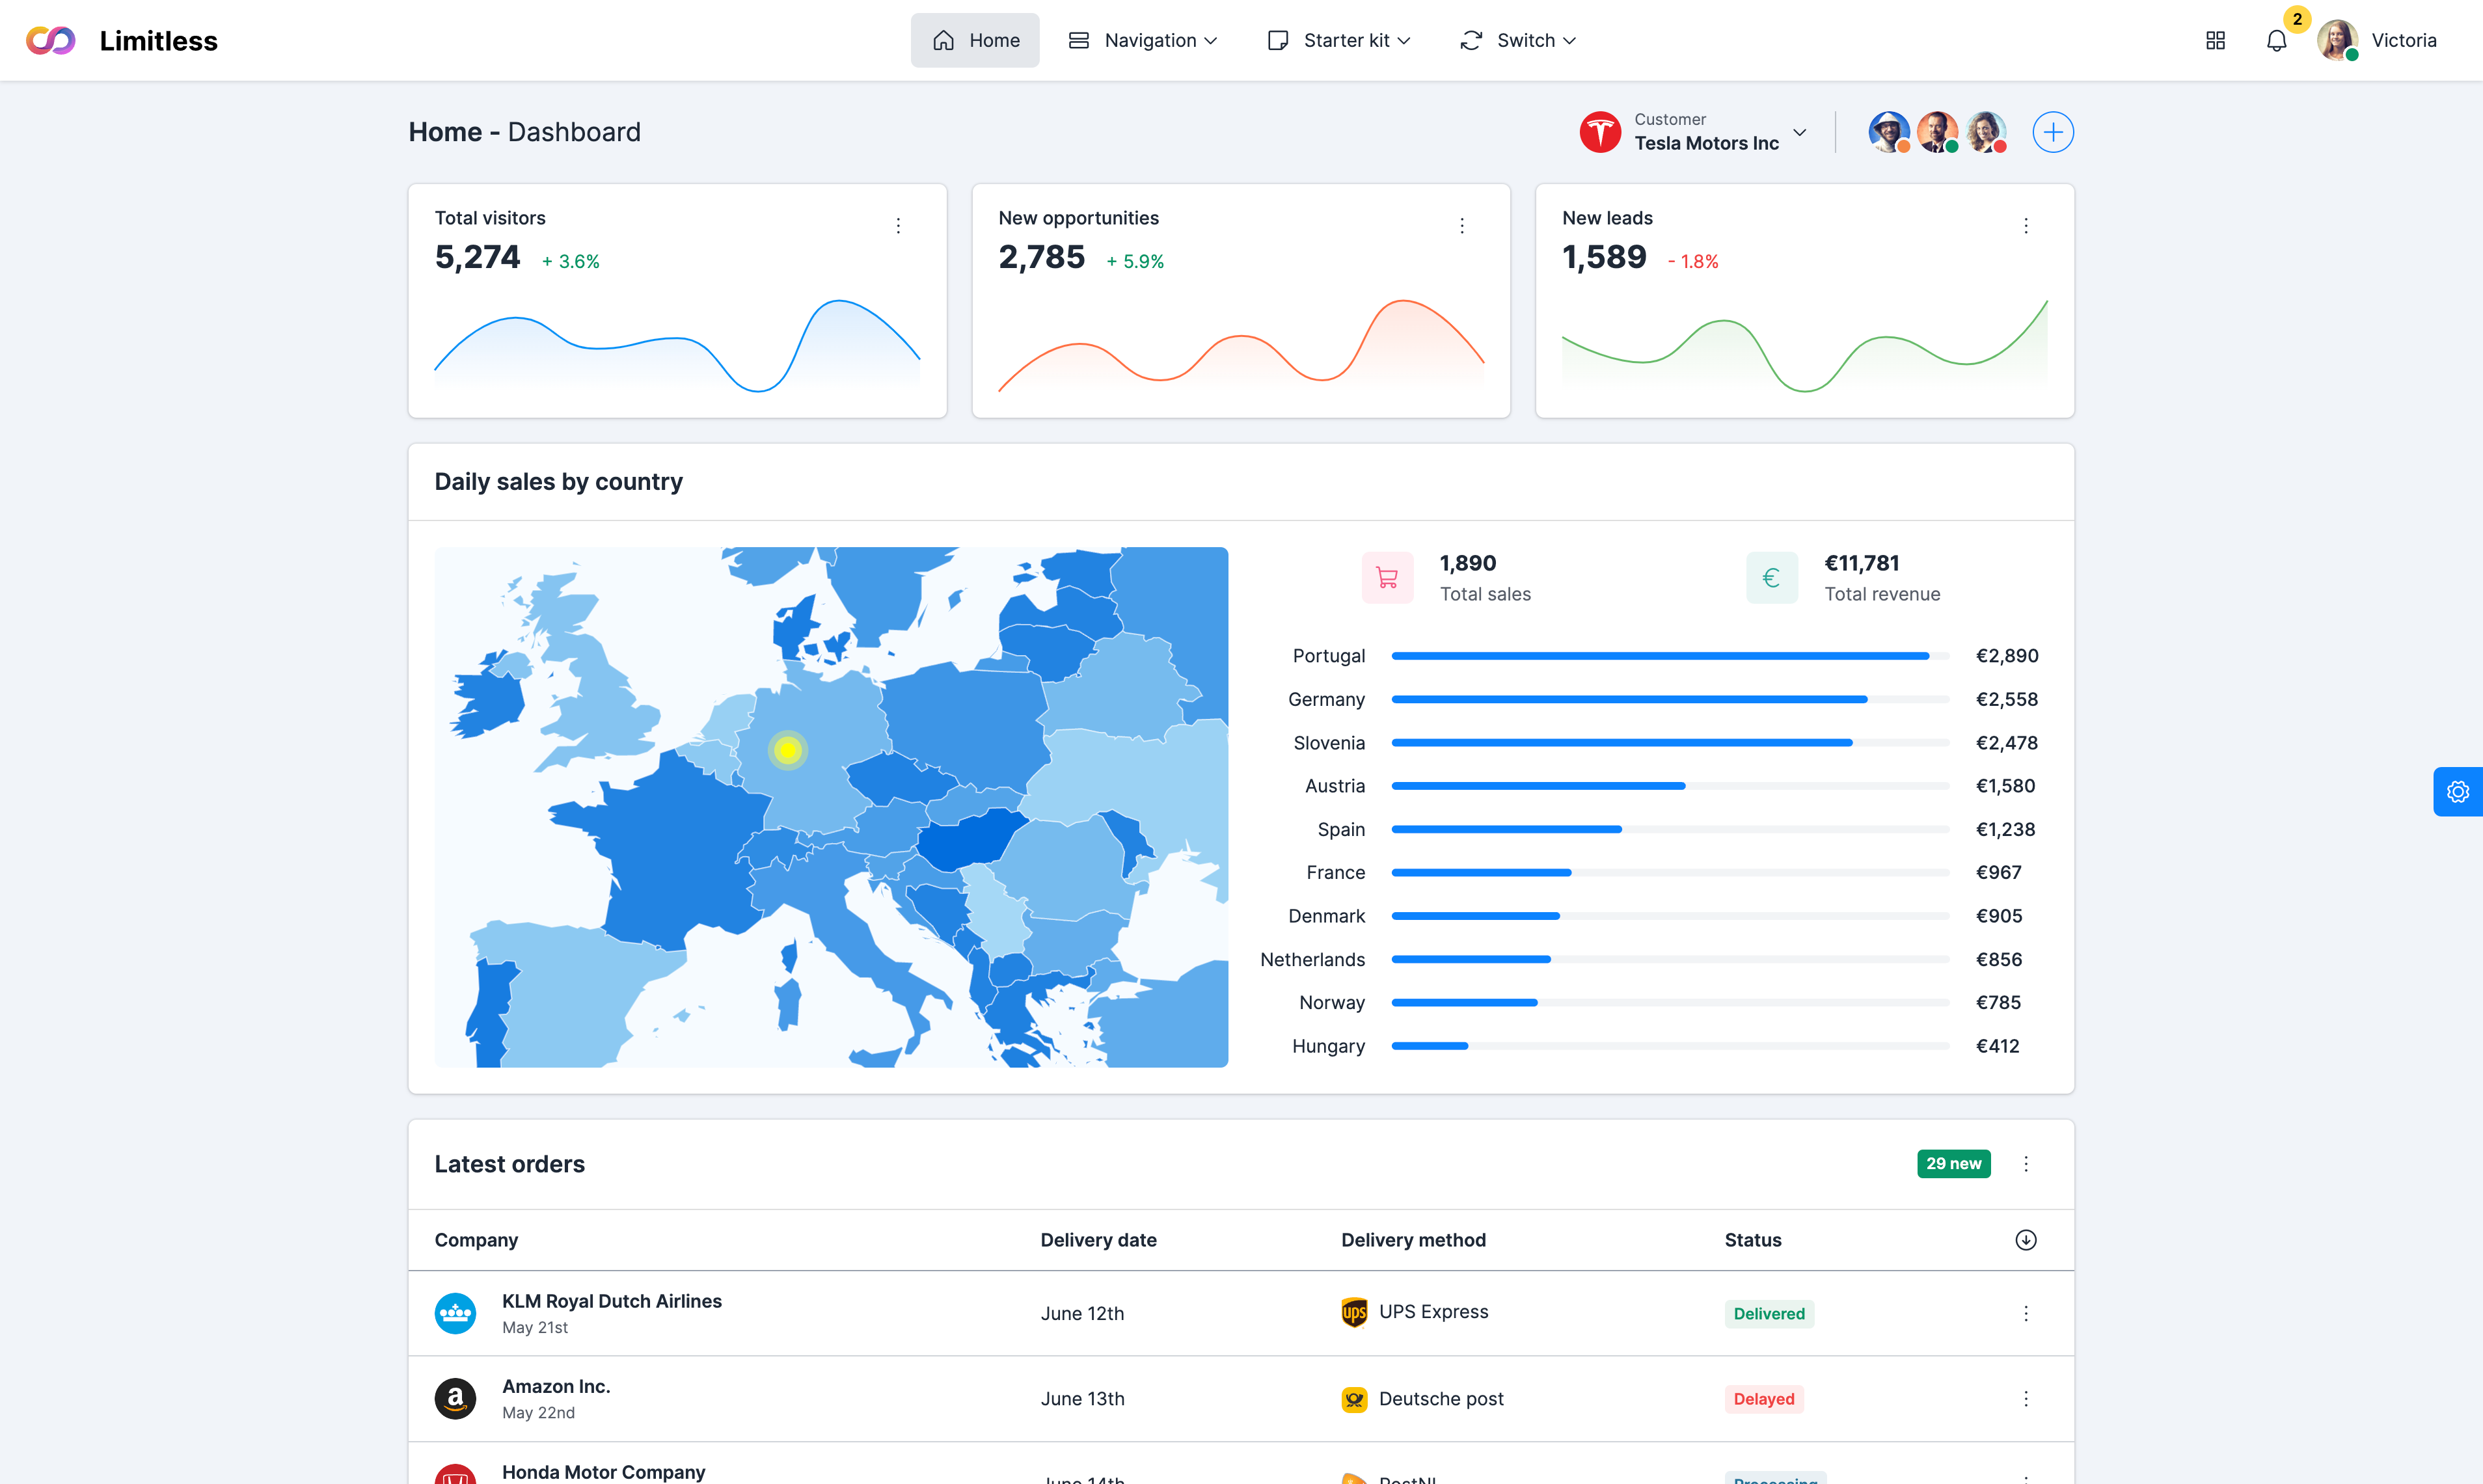
Basic map
Leaflet is the leading open-source JavaScript library for mobile-friendly interactive maps. Weighing just about 42 KB of JS, it has all the mapping features most developers ever need. Leaflet is designed with simplicity, performance and usability in mind. It works efficiently across all major desktop and mobile platforms, can be extended with lots of plugins, has a beautiful, easy to use and well-documented API and a simple, readable source code.
Cluster groups
Beautiful, sophisticated, high performance marker clustering solution with smooth animations and lots of great features. All elements are highly configurable - colors, images, sizes etc. In this example address points are stored in json format in a separate JS file, but data can be also embedded into map configuration. Click on a cluster to zoom to its bounds.
Using GeoJSON
GeoJSON is a very popular data format among many GIS technologies and services — it's simple, lightweight, straightforward, and Leaflet is quite good at handling it. In this example, you'll learn how to create and interact with map vectors created from GeoJSON objects. Leaflet supports all of the GeoJSON types, but Features and FeatureCollections work best as they allow you to describe features with a set of properties. We can even use these properties to style our Leaflet vectors
Layer groups and control
Leaflet has a nice little control that allows your users to control which layers they see on your map. In addition to showing you how to use it, we’ll also show you another handy use for layer groups. In this example, we want to have two base layers (a grayscale and a colored base map) to switch between, and an overlay to switch on and off: the city markers we created earlier


